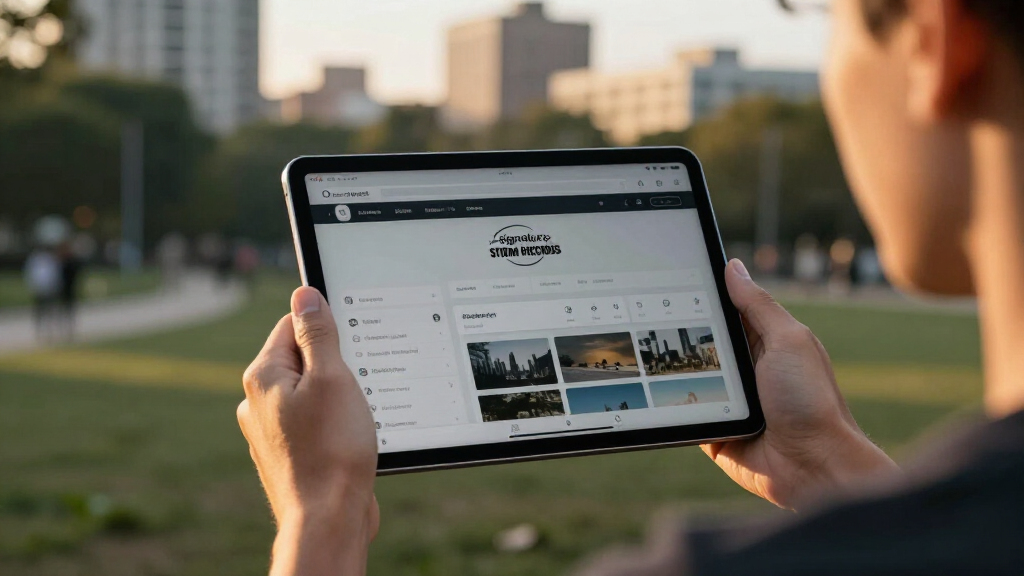

📊 Full opportunity report: A New Era For AI Data: Signature Storm Records Rendered Without Images on ThorstenMeyerAI.com — validation score, market gap, and execution plan.

Get the latest gadgets delivered free with Prime
- Fast, free delivery on millions of items
- Prime Video, Amazon Music and more included
- Member-only deals all year
TL;DR
An innovative AI project visualizes supercell storms solely with procedural graphics, avoiding traditional images. This demonstrates new possibilities for data-driven weather visualization.
An AI-driven visualization project has demonstrated the ability to render complex storm phenomena entirely through procedural graphics, without relying on any external image assets. This development, showcased in the ‘Vortex Field Unit — Plains Intercept Archive,’ highlights a novel approach to weather data visualization that emphasizes data accuracy and disciplined graphic generation. The project’s creators aim to showcase how detailed, dynamic storm simulations can be achieved solely through code, marking a significant shift in digital weather storytelling.
The visualization employs HTML, CSS, and JavaScript to generate layered, animated representations of supercell storms, including funnel clouds, radar hooks, and reflectivity patterns. All visual elements are procedurally generated, synchronized with a scroll-driven interface that simulates storm evolution from initiation to dissipation. This approach avoids static images or external media, relying instead on animated SVGs, canvas, and WebGL techniques to portray storm dynamics in real-time.
According to the project’s art director, the design uses a restrained color palette—deep greens, dark grays, and amber accents—to evoke a stormy atmosphere while maintaining clarity. Typography and telemetry data are integrated with monospaced fonts and condensed display elements, ensuring legibility and data integrity. The entire system is built without external requests, frameworks, or image assets, demonstrating a self-contained, code-driven visualization pipeline.
Developed through a rigorous, three-stage process—building, critique, and art-direction—the project aims to balance technical precision with visual storytelling. The creators emphasize that their focus remains on data agreement and disciplined visualization, rather than relying on static imagery or external media sources.
A New Era for AI Data: Signature Storm Records Rendered Without Images
The Vortex Field Unit — Plains Intercept Archive renders supercell structure, radar hooks, reflectivity and storm evolution entirely through procedural graphics. No stock photography. No external image assets. Just code, data and disciplined visual direction.
A storm assembled from data primitives
Layered SVG, canvas and WebGL techniques replace conventional media assets. A scroll-driven sequence synchronizes visual components to portray storm development from initiation through dissipation.
Procedural storm structure
Generated layers depict supercell organization, funnel clouds and evolving atmospheric shapes without importing static pictures.
Hooks and reflectivity
Graphic rules translate radar concepts into animated hooks, intensity fields and readable patterns that remain tied to data logic.
Scroll-synchronized evolution
The interface reveals a storm as a sequence, turning changing conditions into an explorable visual record rather than a fixed frame.
From raw inputs to visual evidence
The project combines technical generation with a deliberate editorial workflow. Each stage checks whether the visual system communicates storm behavior clearly and consistently.
Storm variables and telemetry define the visual state.
Code constructs shapes, fields, motion and layered depth.
Visual output is checked for clarity and data agreement.
Palette, typography and pacing reinforce the narrative.
The browser produces a self-contained storm record.
Three-stage discipline: building establishes the system, critique tests the result, and art direction aligns precision with visual storytelling.
Procedural graphics versus traditional weather imagery
The procedural approach does not eliminate the value of satellite or photographic evidence. It introduces a complementary format optimized for adaptation, interaction and controlled visual explanation.
| Capability | Static imagery | Procedural system | Current project status |
|---|---|---|---|
| External image dependency | Required | None | Demonstrated |
| Dynamic storm evolution | Limited | Built in | Demonstrated |
| Rule-based customization | Low | High | Demonstrated |
| Operational live forecasting | Established | Possible | Not validated |
| Scientific ground truth | Direct evidence | Input dependent | Further testing needed |
Assessment reflects the public demonstration described in the project report, not an operational meteorological certification.
Strong creative potential, early operational readiness
The system already proves that a sophisticated weather narrative can be constructed without image assets. Its next challenge is moving from compelling demonstration to validated real-world infrastructure.
Demonstrated capability profile
Qualitative assessment based on the capabilities reported for the current project.
What must be proven next?
The most consequential work now lies beyond aesthetics: real data ingestion, scientific validation, reliability under changing conditions and integration with existing weather systems.
Can it operate in real time?
Live storm tracking requires continuous data ingestion, low-latency rendering and stable performance during rapidly changing events.
Does the rendering stay accurate?
Meteorological experts must test whether generated forms consistently agree with source data and established scientific interpretation.
Can it generalize?
A deployable system must adapt beyond supercells to different storm structures, environments, scales and data quality levels.
Where does it add the most value?
Education, public communication and interactive research may offer the clearest early uses before operational forecasting.
The path from code to public understanding
Procedural visualization is valuable when every visual decision remains connected to its source logic. The chain below captures the project’s central promise.
Measured input
Storm variables establish the factual basis for the scene.
Graphic logic
Procedural rules translate values into form, motion and intensity.
Dynamic record
The browser assembles synchronized layers without image requests.
Human insight
Readers explore storm evolution through a clear visual narrative.
Code is no longer only the delivery mechanism. In procedural weather visualization, code becomes the image, the narrative and the traceable link back to data.
Implications of Image-Free AI Weather Visualizations
This development matters because it pushes the boundaries of how weather data can be represented digitally, emphasizing procedural graphics over traditional imagery. It offers a new method for creating dynamic, accurate storm simulations that are fully code-driven, potentially reducing reliance on external media assets and enabling more flexible, scalable visualizations. Such approaches could influence future weather visualization tools, educational platforms, and real-time storm tracking systems, making complex phenomena more accessible and customizable.
Additionally, this approach highlights the potential for AI and procedural graphics to enhance scientific communication, allowing for more disciplined and precise representations of natural events. It also raises questions about the future of digital storytelling in meteorology, where code and data visualization may become the primary means of conveying complex phenomena.
As an affiliate, we earn on qualifying purchases.
Background and Evolution of Procedural Weather Visualizations
Traditional weather visualizations have relied heavily on static images, satellite imagery, and external media assets to depict storm phenomena. Recent advances in procedural graphics and AI-driven coding have enabled the creation of dynamic, real-time visualizations that can adapt and evolve based on data inputs. The ‘Vortex Field Unit’ project builds on this trend by demonstrating that entire storm simulations can be generated from scratch using only code, without external image requests or pre-made assets.
This approach aligns with broader movements in digital art and data visualization, where procedural generation and disciplined coding are increasingly used to craft immersive, data-driven narratives. The project also reflects a growing interest in self-contained, scalable visualizations that prioritize data integrity and visual clarity, especially in scientific and educational contexts.
“This project demonstrates that complex weather phenomena can be visualized entirely through procedural graphics, emphasizing data accuracy and disciplined visualization over traditional imagery.”
— an anonymous researcher
Unanswered Questions About Practical Applications
It is not yet clear how this procedural approach performs in real-time storm tracking or whether it can be integrated into operational weather forecasting systems. The project remains a demonstration rather than a deployable tool, and its scalability or accuracy in live environments has not been publicly tested or validated.
Further development is needed to determine if this method can handle real-world data inputs, adapt to different storm types, or be used in interactive, user-driven applications. The long-term reliability and potential limitations of purely code-based visualizations remain to be explored.
Future Development and Potential Integration
The creators plan to refine the procedural graphics system, improve data integration, and explore interactive features that could make the visualization more accessible and informative. They aim to demonstrate the system’s scalability and accuracy in more complex scenarios and potentially collaborate with meteorological agencies for validation.
Next steps include testing the approach with real storm data, expanding the visualization’s capabilities, and exploring how this method can be incorporated into educational tools, public weather services, or scientific research platforms. The project’s open-source nature invites further experimentation and adaptation.
Key Questions
How does this visualization differ from traditional weather images?
It is entirely generated through procedural graphics using code, without relying on static images or external media assets, providing a dynamic and scalable representation of storms.
Can this approach be used for real-time weather forecasting?
Currently, it is a demonstration project; further development is needed to adapt it for operational, real-time forecasting or live storm tracking systems.
What are the advantages of procedural graphics in weather visualization?
They offer flexibility, scalability, and data accuracy, allowing for detailed, animated representations that can be customized and updated easily without external image dependencies.
Is this method suitable for educational purposes?
Yes, its self-contained, code-driven nature makes it a promising tool for educational demonstrations of storm dynamics and weather phenomena.
Will this approach replace traditional weather visualization methods?
It is unlikely to replace them entirely but could complement existing methods by providing more flexible, data-driven visualizations for specific applications.
Source: ThorstenMeyerAI.com
Fall Picks
fall essentials
As an affiliate, we earn on qualifying purchases.