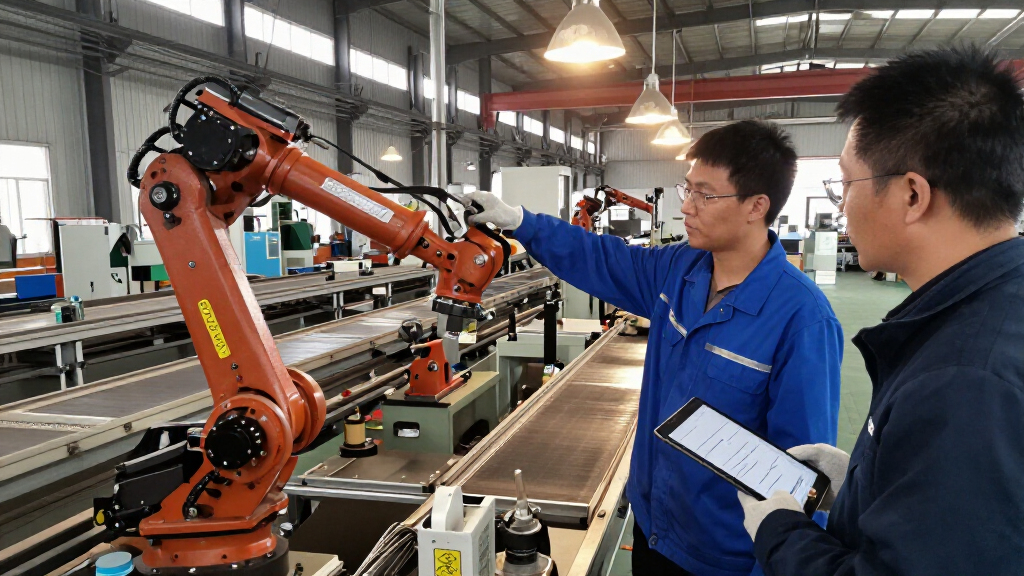

🔍 Read the full analysis: How Factory Jobs Have Changed Alongside AI on ThorstenMeyerAI.com

Get the latest gadgets delivered free with Prime
- Fast, free delivery on millions of items
- Prime Video, Amazon Music and more included
- Member-only deals all year
TL;DR
A November 2026 report from ThorstenMeyerAI.com traces factory employment in the United States, Germany and China, finding that industrial workforces have shrunk from earlier peaks even as production patterns changed. In the U.S., October 2026 factory employment was a preliminary 12.7 million, down 35% from June 1979, while manufacturing output was nearly twice its 1979 level but about 9% below its 2007 peak. The source gives historical context for AI and automation but does not establish how many job changes are attributable to AI.
A November 8 report from ThorstenMeyerAI.com says U.S. factory employment stood at a preliminary 12.7 million in October 2026, 35% below its June 1979 peak, even as manufacturing output remained nearly twice its 1979 level. The account places AI within a longer history of changing factory work, but its figures do not isolate AI’s contribution to job losses or production gains.
The report uses the U.S. Bureau of Labor Statistics’ Current Employment Statistics series, which counts payroll jobs at employers outside farming and excludes self-employed people and private-household workers. In June 1979, the series recorded 19.553 million factory jobs, the highest monthly count since the series began in 1939. By October 2026, the preliminary count was 12.7 million, or 8.0% of all U.S. payroll jobs.
The decline was especially sharp from January 2000 to February 2010, when factory employment fell from 17.3 million to 11.4 million, a loss of almost six million jobs. Employment recovered somewhat in the 2010s, fell during the 2020 COVID-19 shock and remained well below the 1979 peak in the latest figure cited by the report.
Output followed a different path. The Federal Reserve’s manufacturing production index was 1.95 times its June 1979 level in September 2026, according to the report’s comparison. But production was still about 9% below its December 2007 peak. The report estimates that output per factory job was roughly three times the 1979 level; it describes this as a rough comparison of jobs, not hours worked.
Fewer Workers, Different Output
The figures show why factory employment and industrial production should not be treated as interchangeable measures. The United States had fewer manufacturing jobs in 2026 than in 1979, yet its reported output was higher over that period. That gap matters to workers, communities and policymakers weighing manufacturing’s economic role: strong production does not necessarily mean a return to earlier employment levels.
The report also complicates a simple story that factories have kept producing more as jobs disappeared. U.S. manufacturing output rose substantially between 1979 and its 2007 peak, but the September 2026 index remained below that peak. Nor does the output-per-job estimate show what happened to individual workers, wages, hours or job quality. It is an aggregate comparison, not a direct measure of AI’s effects.
For readers focused on AI, the central implication is a limit on what this history can prove. Long-term changes in production and employment show that factory work has been reshaped over decades, but the reported totals alone cannot identify which changes came from AI, other technologies, trade, recessions or shifts in demand.
Products Worth Considering

Sonos Play Portable Wi-Fi and Bluetooth Speaker, White

Anker SOLIX C1000 Gen 2 Portable Power Station, 1,024Wh

LG UltraGear 32GX850A-B 32-inch 4K UHD OLED Gaming Monitor
As an affiliate, we earn on qualifying purchases.
The Peaks Came Years Apart
Factory employment’s share of U.S. payroll jobs reached its peak earlier than the number of jobs did. In November 1943, factories accounted for 38.8% of payroll jobs; the count was 16.6 million. The share then declined while the overall economy expanded. In June 1979, the number of factory jobs reached its series high, but factories represented 21.7% of payroll employment.
The report describes similar long-run shifts outside the United States, while noting that national measures differ. In West Germany, industry and construction employed 49.2% of workers in 1965. For unified Germany, the comparable broad sector accounted for 22.9% in 2025, according to the report’s account of national statistics. Its figures include construction, energy, water and mining as well as manufacturing.
China’s industry and construction employment reportedly peaked at 232 million in 2012. The source also cautions against attributing the entire U.S. decline to imports from China: the American fall began 22 years before China joined the World Trade Organization. It cites economists’ estimates that rising Chinese imports cost up to about one million U.S. factory jobs from 1999 to 2011, out of almost six million lost during that period. That is an attributed estimate, not a complete accounting of the decline.
“The number to remember is 19.6 million.”
— Thorsten Meyer, ThorstenMeyerAI.com
The source does not provide a separate estimate of jobs lost or created because of artificial intelligence. Its long-run employment and output series cover many decades and do not distinguish AI from robotics, other productivity improvements, trade, changing consumer demand, recessions or industry-specific shifts.
The October 2026 U.S. employment figure is labeled preliminary, and the report’s estimate of output per factory job compares job counts rather than hours worked. The cited cross-country measures also cover different sector definitions and periods, limiting direct comparisons. The material supplied does not include detailed evidence about which factory tasks AI systems perform, how widely they are being adopted, or their effects on wages and hiring.
Tracking Jobs and Production
The next useful indicators are updated BLS payroll figures and Federal Reserve manufacturing production data, which can show whether the October employment count is revised and whether output moves closer to or farther from its 2007 high. Any assessment of AI’s role will require more specific evidence than the historical totals presented here, including data on adoption, affected occupations, hours, pay and hiring.
Until those measures are available, the report’s central finding is historical rather than a forecast: U.S. factory employment remains far below its 1979 peak, while output is higher than in 1979 but below its 2007 peak. How much of the employment and output shift is linked to AI remains unquantified in the source.
Key Questions
How many people worked in U.S. factories at the 1979 peak?
The report cites 19.553 million factory payroll jobs in June 1979, seasonally adjusted—the highest count in the BLS series it describes.
How many U.S. factory jobs were reported in October 2026?
The report gives a preliminary figure of 12.7 million, equal to 8.0% of all payroll jobs. The figure may be revised.
Has U.S. factory output fallen along with employment?
Not across the full period cited. Manufacturing output in September 2026 was about 1.95 times its June 1979 level, but remained roughly 9% below its December 2007 high.
Does the report say AI caused the factory job decline?
No. It discusses factory work alongside AI, but the figures do not measure AI’s contribution. The report describes changes spanning decades and notes other possible factors, including trade, recessions and productivity changes.
Source: ThorstenMeyerAI.com